Direct Bookings, Booking.com and Expedia: Reading HOTREC’s 2026 Study
October 29, 2026
Research period: October 2026
By COTT.TV Hospitality Technology Research Desk·Published October 29, 2026·9 min read


Quick Summary
In HOTREC and HES-SO’s study, direct channels account for 51.3% of weighted European overnights in the 2025 reference year. Online intermediaries account for 32.3%, including a 29.9% OTA subset; these figures must not be added together. The estimates are not commission or prof…
A distribution report can help a hotel ask better questions, but it cannot choose that hotel’s channel mix. HOTREC and HES-SO’s European Hotel Distribution Study 2026 reports how hotel overnights were distributed among booking channels in its 2025 reference year. It does not establish which channel produced the best margin for a particular property. Owners, general managers and distribution teams need both perspectives: an accurate reading of the research and a property-level account of revenue and costs.
What the study measured, and whom it surveyed
Published in September 2026, the study uses 2025 as its reference year. Its survey ran from February to May 2026. The evidence comprises 2,713 hotels: 1,882 individual responses from 28 countries and aggregate data covering 831 chain properties. The individual responses are weighted toward smaller and medium-sized enterprises; their median property has 39 rooms.
Those distinctions matter when applying the findings to a portfolio or a large city hotel. The weighted European channel estimates exclude the chain aggregates. They describe shares of overnights, rather than shares of reservations or room revenue. A long stay and a short stay therefore have different weight in this measure, even if each began as one reservation. The estimates are not a census of every European hotel, and a group should not treat them as a substitute for its own property-level reporting.
The report’s geographic scope is European. It should not be read as an EU-only result or as a current national forecast. Nor does a study published in 2026 turn its 2025 reference-year distribution into a 2026 observation. Its strongest use here is as a carefully defined comparison point: what does a hotel’s own share of overnights look like when channels are classified consistently?
Keep the channel denominators straight
Direct channels account for 51.3% of weighted European overnights in the study. Online intermediaries account for 32.3%; this broader category includes OTAs, global distribution systems and social channels. OTAs account for 29.9% of all weighted overnights and sit inside, not alongside, the online-intermediary figure. Adding 29.9% to 32.3% would count OTA overnights twice.
Separately, the report’s unweighted relative OTA market-share table reports Booking Holdings at 68.8% and Expedia Group at 16.6%. These group-level figures concern the OTA segment and are not the same weighted measure as the overnight distribution shares above. Do not combine the two calculations to infer a group’s share of all hotel overnights. Booking Holdings is also broader than the Booking.com brand: its figure must not be relabelled as a Booking.com-only share. Neither group figure describes an individual hotel’s contract or profitability.
None of these percentages is a commission, a booking-conversion rate or a profitability finding. Nor does a large share show that a channel created demand that would otherwise have been absent. It shows where the measured overnights were attributed. A hotel deciding how much inventory to offer through any channel needs its own evidence about demand, displacement and costs.
Why a large urban hotel may need a different comparison
A large urban property can serve several demand patterns at once: guests planning well ahead, short-notice stays, repeat visitors and business travel. Those patterns may call for different distribution decisions across dates and room types. That is an operational reason to examine segments separately, not a claim that the study establishes a particular OTA share for large city hotels.
Scale changes the work of making those decisions. A hotel group may have central marketing expenditure, local sales activity and shared technology costs that are difficult to assign to one reservation. A large property may also sell the same room type through several systems, making reliable availability and clear ownership of updates particularly important. Smaller properties face the same underlying questions, but may organise the work differently. Neither size nor location alone says whether a direct reservation is cheaper to acquire.
Start with the hotel’s own overnights by channel, property and stay period. Keep group brands distinct from individual booking sites where the data permits, and document any reservations whose source cannot be confidently classified. Then look at occupancy conditions and the length of stay behind the totals. A channel that contributes on dates with otherwise unsold capacity may serve a different purpose from one used when the hotel expects to sell out. The published weighted shares provide context for that investigation, not a target mix to copy.
Compare contribution, not a headline fee
A direct booking avoids some intermediary charges but is not cost-free. Depending on the hotel’s operation, relevant direct-channel costs can include paid acquisition, booking-journey maintenance, payment processing, discounts and the staff time needed to resolve booking problems. Third-party reservations can also involve costs beyond a headline contractual charge. Use actual agreements and accounting records rather than assigning a standard percentage to Booking.com, Expedia or any other named supplier.
For a useful comparison, define a contribution measure before calculating it. Begin with room revenue on a consistent basis, then deduct the acquisition and servicing costs included in that measure. Apply the same treatment to discounts, payment costs and cancellations across channels. Record shared spending separately if it cannot reasonably be allocated to individual stays. Otherwise, a precise-looking channel comparison can depend more on inconsistent definitions than on commercial performance.
An equal-revenue example shows the arithmetic, not a market result. Everything in the following illustration is hypothetical; the channels are anonymous, and the percentages are assumed total channel-specific costs, not quoted supplier fees. Suppose either channel sells one room night for EUR 150. Assume a direct channel incurs EUR 18 in included costs, equivalent to 12% of that revenue, and an intermediary channel incurs EUR 22.50, equivalent to 15%. On this deliberately limited definition, the direct night contributes EUR 132 and the intermediary night EUR 127.50, a difference of EUR 4.50.
That comparison assumes equal room revenue and includes no difference in length of stay, cancellation outcome, ancillary spending, variable room-service costs or the likelihood that the room would otherwise remain empty. Changing the assumptions can change the decision. It would be wrong to present the EUR 4.50 difference as a measured saving, a COTT.TV result or proof that shifting a reservation between channels creates additional revenue. For a real decision, calculate contribution with the hotel’s own definitions and test whether the alternative booking is realistically available on the same dates.
An action plan grounded in property data
Make inventory accuracy a shared responsibility. Agree which system and team own each rate, restriction and availability update. Reconcile discrepancies between the property-management system, channel manager, own booking journey and intermediary listings. Give staff a clear route for investigating an exception rather than assuming every update succeeds. Booking.com’s Rates and Availability API overview documents an interface for rates and availability; the existence of that documentation does not establish that a particular hotel system has a live connection or that updates need no monitoring.
Inspect the direct journey as a guest would. Check whether dates, room conditions, total price, payment information and cancellation terms are understandable before confirmation. Follow the path on the devices guests actually use and record where an attempted reservation fails or requires staff help. This is an editorial recommendation, not a finding measured by HOTREC. COTT.TV’s guest-TV demo shows a different guest-facing context; it is not a booking-engine demo or evidence of an OTA connection.
Review repeat-guest communication carefully. Decide which post-stay messages are useful, what permission and preferences govern them, and how the hotel will handle replies. A clear reason to book directly next time may matter more than a blanket discount that erodes contribution. Check applicable contractual terms and legal requirements before changing guest communications or public rates; do not assume one universal OTA rate-parity obligation.
Give the review a regular owner. Have commercial, operations, finance and technology colleagues agree on channel definitions, exceptions and the costs each report includes. Compare overnights and contribution by relevant stay periods, then investigate changes rather than treating every movement in direct share as good or bad. For groups, retain a view by property as well as an aggregate view so unlike markets are not hidden in one average. COTT.TV’s COTT DESK hotel PMS page describes an early-access product; it should not be taken as proof of a live Booking.com integration.
Decision reference
| Study measure | Reported share | Denominator |
|---|---|---|
| Direct channels | 51.3% | Weighted European overnights, excluding chain aggregates |
| Online intermediaries | 32.3% | Same total; includes the OTA subset |
| OTAs | 29.9% | Same total; do not add this to online intermediaries |
Practical questions
Does the study say direct bookings are always more profitable?
No. It measures channel shares of overnights. Profitability requires the hotel’s acquisition and servicing costs, revenue definitions and evidence of incremental demand.
Are Booking Holdings and Booking.com interchangeable in these figures?
No. Booking Holdings is the wider group. Its study share should not be labelled as the share of the Booking.com brand alone.
Sources and methodology
The channel figures and sample description above come from HOTREC / HES-SO: European Hotel Distribution Study 2026, reference year 2025. The study was published in September 2026, surveyed hotels from February to May 2026 and concerns the 2025 reference year. Its weighted European distribution estimates exclude the aggregate chain data; the individual responses are SME-heavy. The separately cited relative OTA group shares are unweighted, as labelled in the report’s table on page 92, and should not be combined with the weighted overnight estimates. Shares refer to overnights, not reservation counts, revenue, commissions or profit. The report does not supply a universal property-level channel prescription, and its European estimates should not be presented as EU figures or national forecasts.
The separate Booking.com Rates and Availability API overview is used only to identify the documented rates-and-availability interface, not to verify any COTT.TV integration. The operational suggestions and contribution framework are editorial reasoning, not additional study findings, customer measurements or a product certification. The EUR example is explicitly hypothetical. Evidence for this article was reviewed on 23 October 2026; no later evidence check is implied.
Editorial visual: Inn. TRENDS.
Related Posts

EU Tourism Demand in H1 2026: What Hotels Can—and Cannot—Learn
2026-10-25
EU tourist-accommodation guest nights rose in the first half of 2026, but national changes are not hotel forecasts. Here is how to use the data alongside property records to make better service and distribution decisions.
Introducing COTT DESK: Hotel PMS, Built Around the Hotel Day
2026-10-15
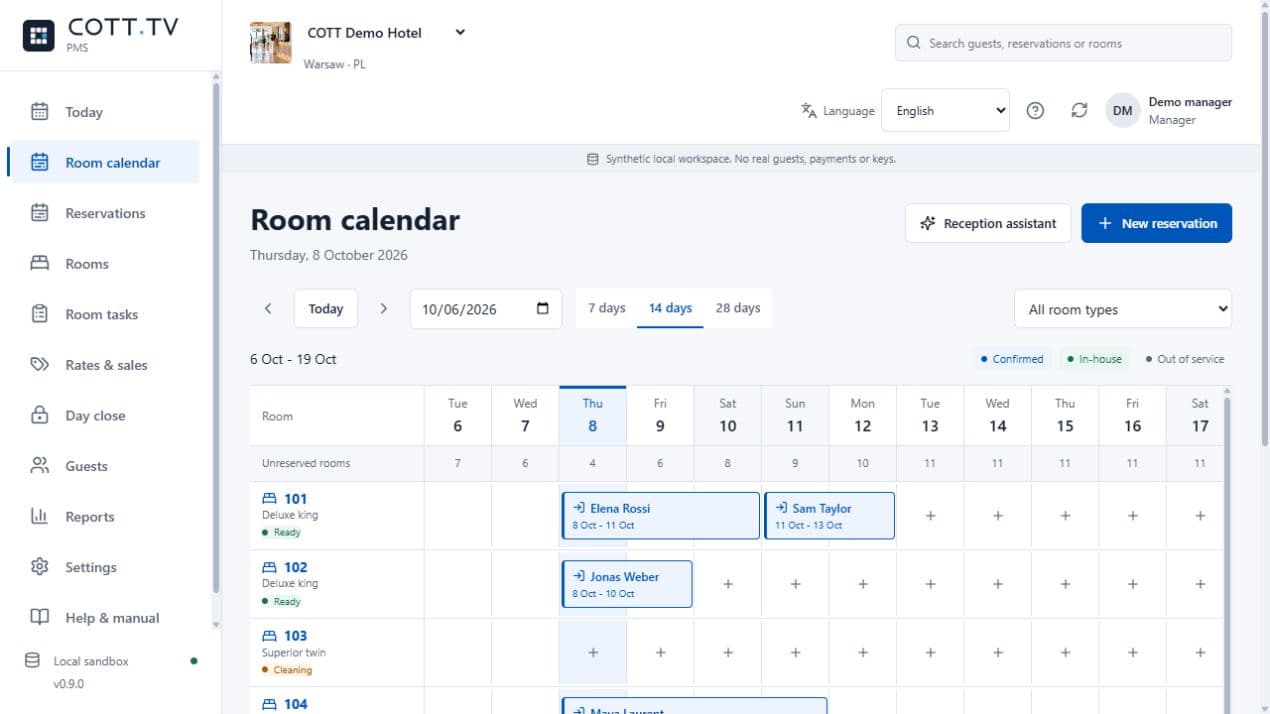
COTT DESK brings reservations, reception, housekeeping and guest accounts together. Applications open for a selected 90-day Founding Hotels pilot.
Hotel IPTV System Requirements: The 2027 Pre-Tender Checklist
2026-09-24
A vendor-neutral requirements framework for rooms, televisions, networks, content, PMS events, security, monitoring and acceptance.